Experience Lodges
Our flagship offering, Eleven Experience Lodges are full-service travel experiences set in one-of- a-kind locations with world-class accommodations.
Adventure Lodges
Ideally suited for the core adventure enthusiast, Eleven Adventure Lodges are remote hideouts with premium accommodations that offer unparalleled experiences.


HOMES
Privately Owned Residences, Vetted and Approved by Eleven®
Our carefully curated selection of privately owned residences are available for longer term rentals and comply with all local rental regulations. Eleven has coordinated with a select group of third-party private owners to offer this unique collection of properties that are only available as full home rentals. These properties are unstaffed, and do not include additional guided adventures and culinary services. Although, if you are interested in additional services, we would be happy to help coordinate these for you with local experts.
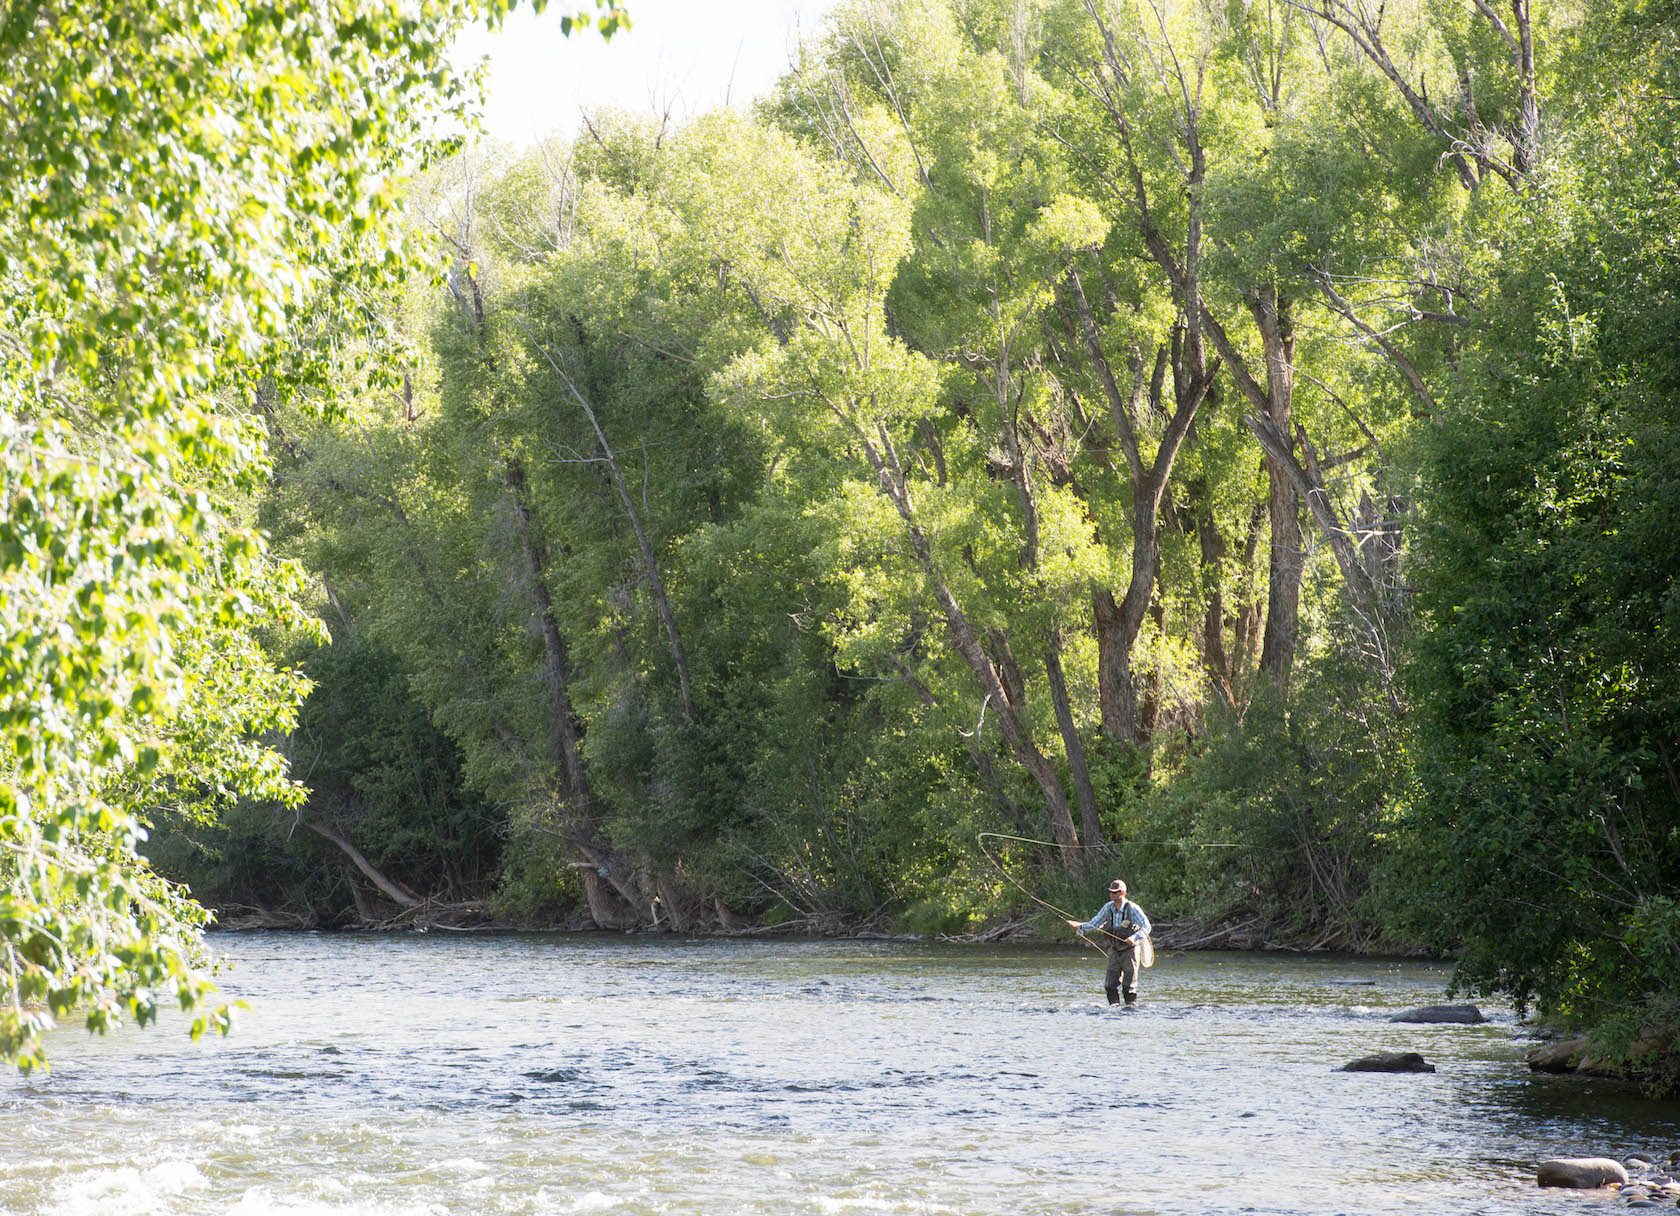
Colorado Water Conditions
Most any Colorado local will tell you to hit the river. It’s the pulse of the mountains, and whether you play on it, in it, or simply let its cadence wash everyday minutiae away, it’s the ultimate Rocky Mountain High.
N/A
Fishing Report
April 18, 2024Moose Hofer, Director of Global Fishing Operations
Daily Discharge, Cubic Feet Per Second - Stats for July 21, 2017
| Min (1972) | 25th Percentile | Median | Mean | Most Recent Instantaneous Value | 75th Percentile | Max (1995) |
|---|---|---|---|---|---|---|
| 147 | 252 | 339 | 380 | 406 | 426 | 1280 |
Taylor River Below Reservoir
Information sourced daily from waterdata.usgs.gov
Daily Discharge, Cubic Feet Per Second - Stats for July 21, 2017
| Min (1913) | 25th Percentile | Median | Mean | Most Recent Instantaneous Value | 75th Percentile | Max (1995) |
|---|---|---|---|---|---|---|
| 91 | 363 | 454 | 507 | 606 | 618 | 1710 |
Taylor River at Almont
Information sourced daily from waterdata.usgs.gov
Daily Discharge, Cubic Feet Per Second - Stats for July 21, 2017
| Min (1977) | 25th Percentile | Median | Mean | Most Recent Instantaneous Value | 75th Percentile | Max (1995) |
|---|---|---|---|---|---|---|
| 70 | 200 | 349 | 413 | 504 | 517 | 1700 |
East River at Almont
Information sourced daily from waterdata.usgs.gov
Daily Discharge, Cubic Feet Per Second - Stats for July 21, 2017
| Min (1977) | 25th Percentile | Median | Mean | Most Recent Instantaneous Value | 75th Percentile | Max (1995) |
|---|---|---|---|---|---|---|
| 256 | 636 | 852 | 1030 | 1100 | 1280 | 4060 |
Gunnison River Near Gunnison
Information sourced daily from waterdata.usgs.gov
Daily Discharge, Cubic Feet Per Second - Stats for July 21, 2017
| Min (2002) | 25th Percentile | Median | Mean | Most Recent Instantaneous Value | 75th Percentile | Max (1957) |
|---|---|---|---|---|---|---|
| 21.7 | 80 | 124 | 170 | 270 | 224 | 662 |
Tomichi Creek at Gunnison
Information sourced daily from waterdata.usgs.gov
Daily Discharge, Cubic Feet Per Second - Stats for July 21, 2017
| Min (2002) | 25th Percentile | Median | Mean | 75th Percentile | Most Recent Instantaneous Value | Max (2011) |
|---|---|---|---|---|---|---|
| 12.2 | 58 | 100 | 99 | 134 | 149 | 222 |
Ohio Creek Above Mouth
Information sourced daily from waterdata.usgs.gov
